AI share of voice: how to calculate, measure, and improve it (2026)

AI share of voice is your brand’s share of all tracked-brand mentions in AI answers: your mentions divided by every tracked brand’s mentions, times 100. Measure it on a fixed set of buyer prompts, competitors, and platforms, run each prompt more than once, and report it next to brand coverage and recommendation rate.
AI share of voice tells you how much of the AI conversation in your category goes to you instead of your competitors. The math fits on a sticky note:
AI share of voice = your brand’s mentions ÷ all tracked brands’ mentions × 100
Everything difficult lives around that formula. Which questions did you ask? Which competitors are in the denominator? Did “mentioned” mean recommended, or just named in passing? Get those wrong and you can report a perfectly calculated number that tells you nothing, or worse, a number that went up because someone quietly removed a competitor from the spreadsheet.
This guide covers the formulas, a free way to measure it, and how to find the gaps that are worth fixing. If you’d rather work along in a spreadsheet, download the free AI share of voice workbook. It has a calculator, a prompt library, an example dataset, a checklist, and an opportunity analysis already set up.
What AI share of voice measures (and what it doesn’t)
AI share of voice is your brand’s relative presence in AI-generated answers, measured against a defined set of competitors, across the prompts, platforms, and markets you chose. That last part matters more than people admit: change the prompts or the competitors and you’ve changed the metric.
A search results page gives each brand its own slot. An AI answer can name three brands in one sentence, mention you without recommending you, or recommend you without citing your site, so you need a few metrics side by side:
| Metric | What it measures | Question it answers |
|---|---|---|
| Brand mentions | Answers that contain your brand name | Did we appear? |
| Brand coverage | Share of completed answers that mention your brand | How consistently do we appear? |
| AI share of voice | Your share of all tracked-brand mentions | How visible are we next to competitors? |
| Recommendation rate | Share of answers that explicitly recommend you | Do we make the shortlist? |
| Citation rate | Share of answers that cite your own site | Are our pages being used as sources? |
An answer like “Acme is an established CRM, but I’d recommend Atlas for this use case” gives both brands a mention and only Atlas a recommendation. On a share of voice chart they look identical, which is exactly why share of voice should never be reported alone.
It also isn’t the share of voice your media team means. Traditional share of voice measures your share of advertising, coverage, impressions, or search visibility. This one measures exposure inside AI answers, and there’s no standard calculation across tools yet: some count mentions, some count answer coverage, some use weighted models. A share of voice number without its numerator and denominator is just a percentage sign.
How to calculate AI share of voice
For a competitive benchmark you can explain to anyone, use mention share. Count each tracked brand once per completed answer, however many times its name appears, then divide your count by the total for every brand in your comparison set.
A worked example with 64 answers
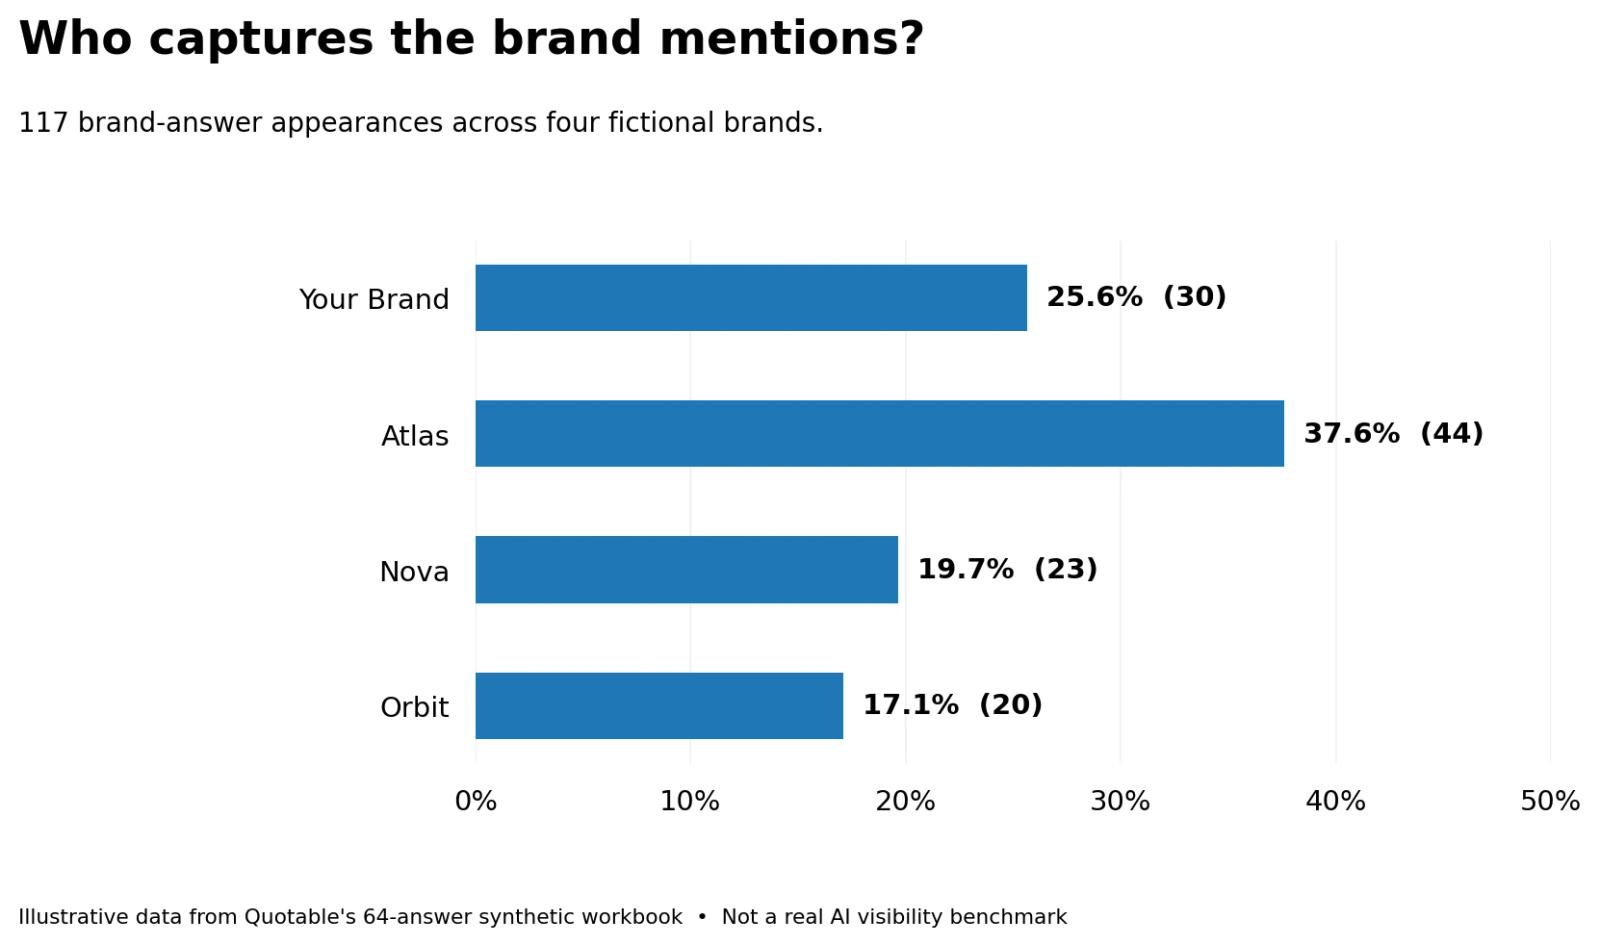
Say you track four made-up project management brands, Your Brand, Atlas, Nova, and Orbit, across 64 AI answers:
| Brand | Answers mentioning the brand |
|---|---|
| Your Brand | 30 |
| Atlas, Nova, and Orbit combined | 87 |
| Total tracked-brand mentions | 117 |
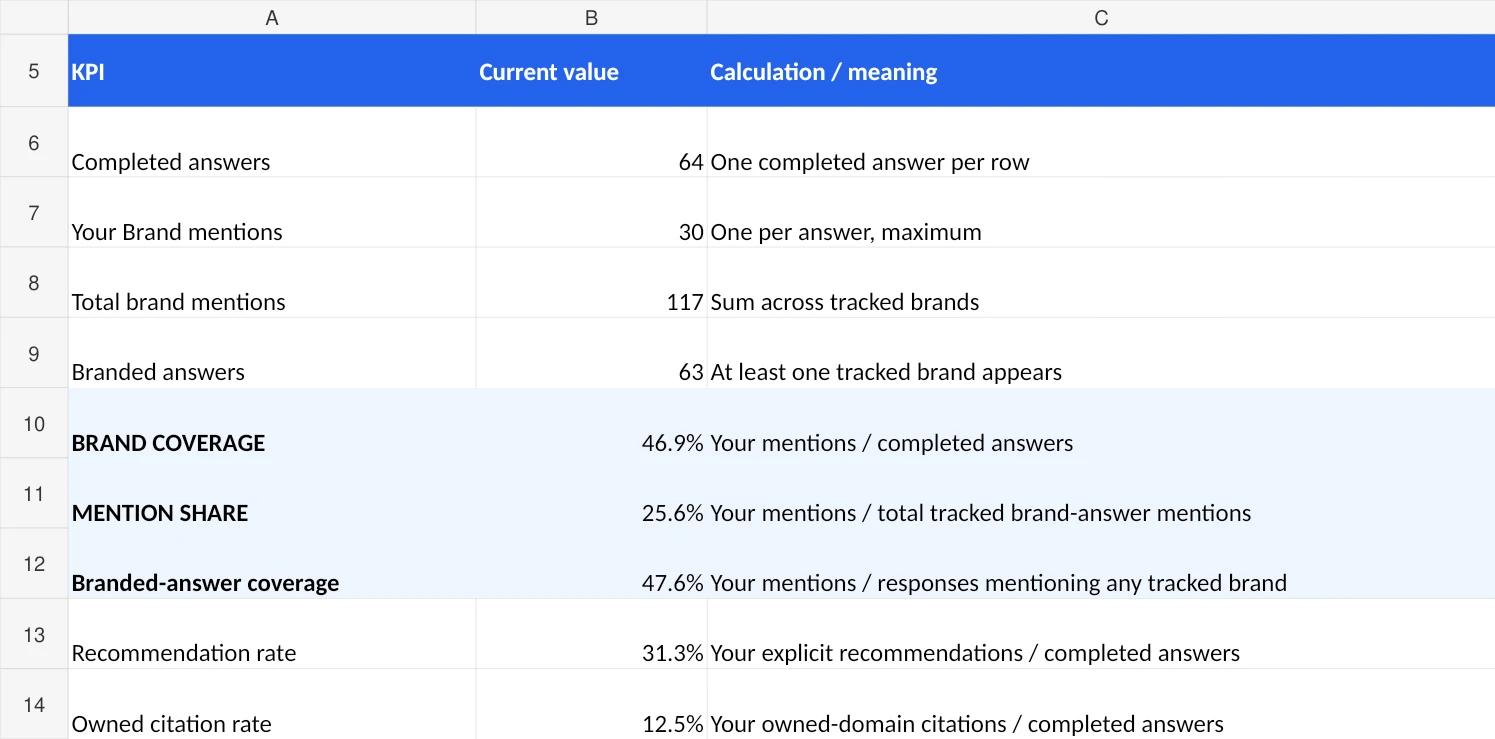
Your mention share is 30 ÷ 117 = 25.6%. That means a quarter of the appearances among these four brands, in this dataset, went to you. It doesn’t mean a quarter of ChatGPT users saw you, and it says nothing about your share of sales.
Here’s where people get confused. The same 30 mentions give you a very different number depending on what you divide by:
| Measurement | Formula | Result |
|---|---|---|
| Mention share | 30 ÷ 117 tracked-brand mentions | 25.6% |
| Brand coverage | 30 ÷ 64 completed answers | 46.9% |
| Branded-answer coverage | 30 ÷ 63 answers that name any tracked brand | 47.6% |
All three are correct, and they answer different questions. Mention share is about you against competitors. Brand coverage is about how often you show up at all, including answers that named nobody you track. Branded-answer coverage drops those empty answers, and because several brands can share one answer, these coverage figures can add up to more than 100% across competitors.
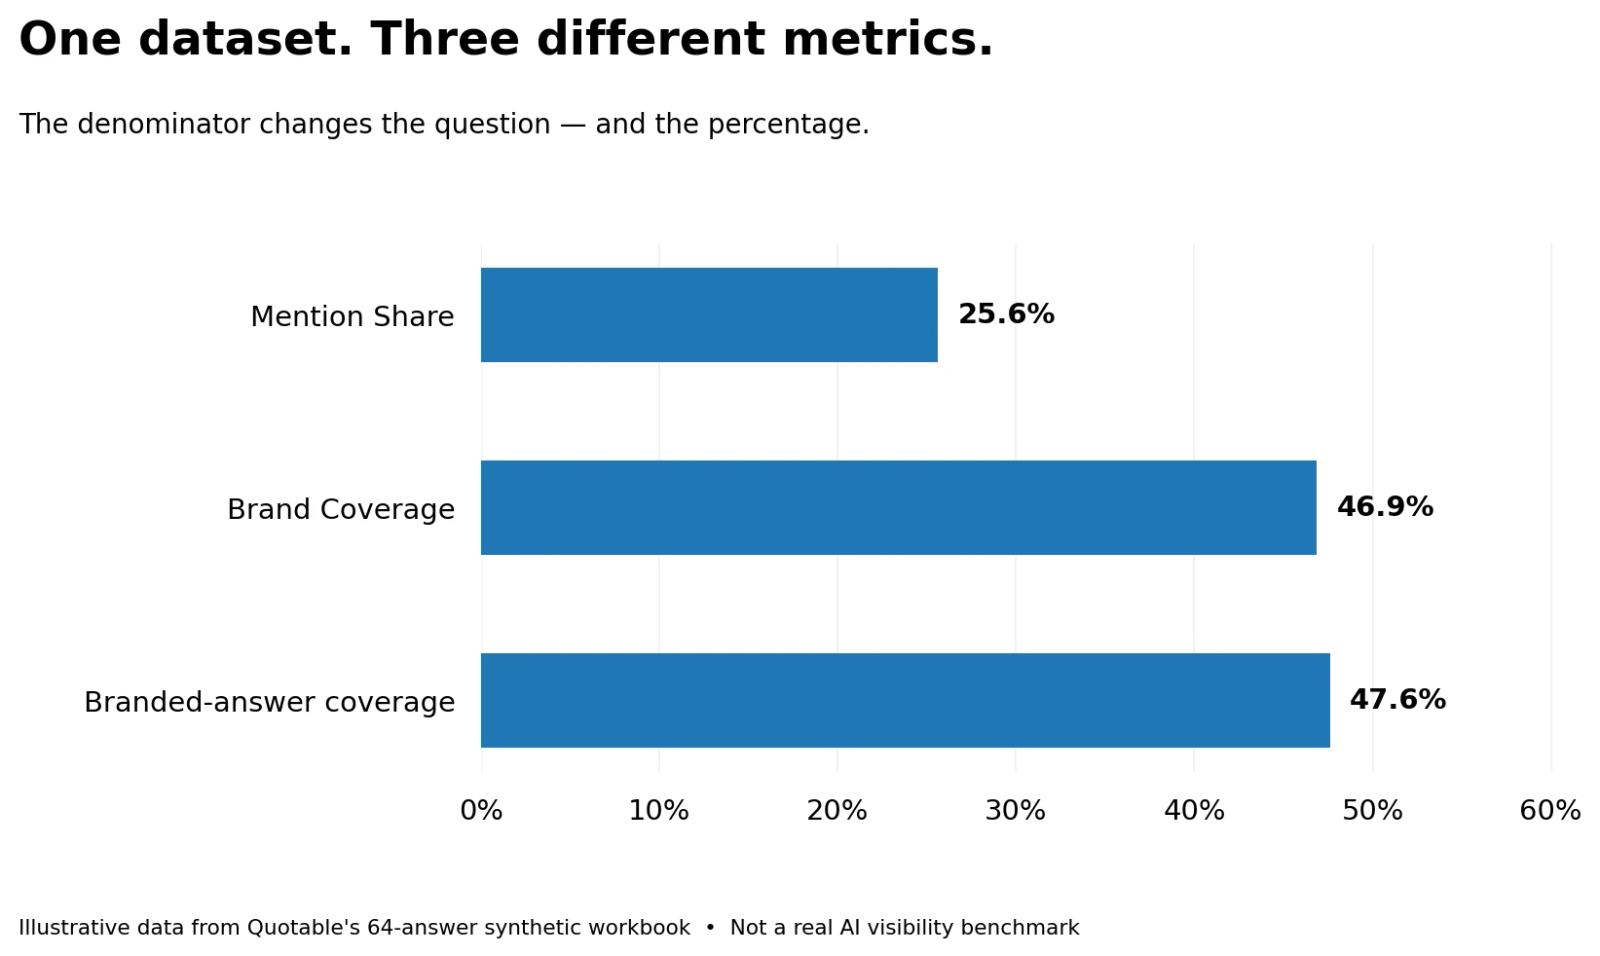
Use mention share as the competitive headline and report brand coverage next to it. If a denominator is zero, write N/A, because a 0% only means something when there were valid observations to score.
The denominator trick
Before you trust any share of voice dashboard, try this. In the example, you have 30 mentions out of 117. Now remove Orbit from the tracked competitors without changing a single answer. Your mention share jumps to 30.9%, a 5.3-point gain, and you didn’t earn one new mention.
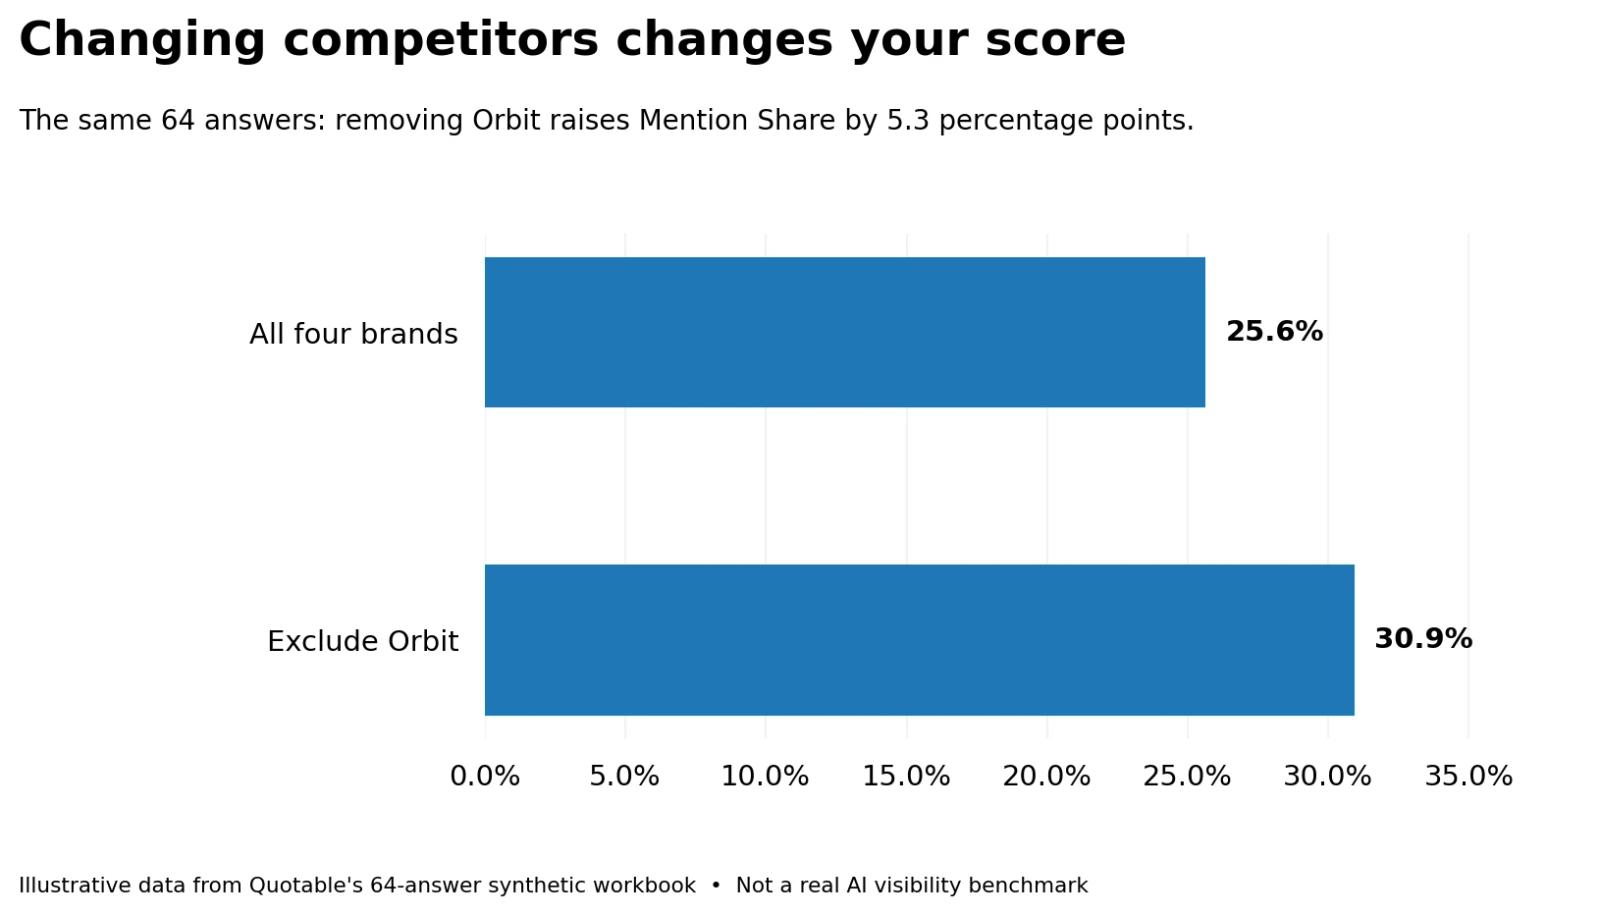
You can reproduce that in the Sensitivity Lab tab of the workbook. It’s the single best reason to freeze your competitor set before you start, and to ask about it whenever someone shows you a share of voice increase.
Should you weight it?
Only with a reason you’d be comfortable writing down. An answer to “What is project management?” is worth less commercially than an answer to “Which project management tool should a 20-person agency buy?”, so weighting by demand or strategic value can make sense. The trouble is that Google keyword volume isn’t AI prompt frequency, and a priority weight your team assigned isn’t observed exposure. If you weight, publish the weights, say where they came from, and report the weighted and unweighted numbers separately. A strategically weighted score presented as market share is fiction with decimals.
Why it’s worth measuring now
AI answers increasingly build the shortlist before a buyer ever reaches your website. McKinsey’s Agentic Commerce Consumer Survey, published in October 2026, found that 81% of AI shoppers said these tools help them narrow down and filter their choices.
That’s consumer shopping, not B2B software buying, and it doesn’t show that a higher share of voice produces revenue. What it does say is that the shortlist increasingly gets formed in a place your analytics can’t see, so the useful question is whether you make it into the consideration set for the situations you care about, and how often your competitors do instead.
How to measure AI share of voice for free
You don’t need software for a first baseline. You pick relevant prompts, collect full answers, record which brands appear, and calculate. The Quotable AI share of voice workbook has eight tabs for this: START HERE with the rules, Dashboard, Prompts, Runs, Methodology, Sensitivity Lab, Opportunity Matrix, and Quality Control. It ships with 64 made-up answers so the formulas have something to calculate; replace them with real, saved responses before you report anything.
Step 1: decide what you’re comparing
Write down the brand, the competitors, the category, the audience, the market, the language, and the AI platforms, for example Your Brand against Atlas, Nova, and Orbit, for project management software, small and midsize businesses, United States, English, on ChatGPT and Gemini.
Pick competitors buyers actually weigh you against, which aren’t always the biggest names. For a project management platform aimed at agencies, a niche agency operations tool can be a more honest comparison than a giant productivity suite, and your sales calls and win/loss notes will tell you which. Decide your alias rules up front too, since a company name, product name, abbreviation, and parent company might be one entity or four. Then freeze the set for the whole comparison period.
Step 2: build prompts from real buying situations
The math can be flawless and the result still misleading if the prompts don’t sound like your buyers. Instead of 100 variations of “best project management software,” split the work into situations:
| Buying situation | Example question | What you learn |
|---|---|---|
| Discover solutions | “How can a small team manage client deadlines without spreadsheets?” | Which brands get associated with the problem |
| Evaluate requirements | “Which project management tools integrate with Slack and Google Workspace?” | Which brands meet stated requirements |
| Compare alternatives | “What are the best project management tools for a 30-person agency?” | Which brands make the comparison set |
| Purchase decision | “Which platform should our agency trial if workload planning is a priority?” | Which brands get explicitly recommended |
Source the wording from sales transcripts, onboarding calls, support tickets, customer interviews, site search, and Search Console, keeping in mind that Google queries show demand for a topic and aren’t transcripts of what people type into assistants. Keep branded questions like “What does Acme cost?” out of your share of voice set, since they test how AI describes a brand and not whether it gets discovered. Twenty to 30 varied prompts is a practical pilot, though nobody has shown it’s a statistically meaningful minimum.

Step 3: run each prompt under recorded conditions
Collect a complete answer for every prompt, and write down the platform and model, language and market, date and time, whether search ran, whether the session had prior context, and the exact wording. A personalized ChatGPT conversation, a fresh session, and an API call can all produce different answers, so if you can’t standardize the conditions, at least record the differences. Save the full response. You’ll need it the day someone asks whether a brand was really recommended or just mentioned.
Step 4: score mentions, recommendations, and citations separately
In the Runs tab, each row is one completed answer. Put a 1 when a tracked brand appears in the text and a 0 when it doesn’t:
| Response | Your Brand | Atlas | Nova | Orbit |
|---|---|---|---|---|
| Answer A | 1 | 1 | 0 | 0 |
| Answer B | 0 | 1 | 1 | 0 |
| Answer C | 1 | 0 | 0 | 1 |
| Answer D | 0 | 0 | 0 | 0 |
Count each brand once per answer, so three repetitions of a name still score 1. Answer D stays in, because dropping answers that name nobody inflates coverage.

Record recommendations and own-domain citations in their own columns. A recommendation needs a consistent rule, such as the answer explicitly presenting the brand as a suitable option, and a passing mention doesn’t qualify. A citation counts only when the URL is on a domain you control, so a third-party review of your product doesn’t. Recommendation rate and citation rate aren’t competitive shares, either. To get a recommendation share you’d have to score every competitor’s recommendations too. Then open the Dashboard, which calculates mention share and brand coverage overall and by buying situation, platform, and period. The calculation is the easy part; the segments are where it gets interesting.
Step 5: repeat prompts before you believe a result
AI answers move between runs. In January 2026, Rand Fishkin and Patrick O’Donnell collected 2,961 runs of recommendation prompts across ChatGPT, Claude, and Google’s AI search and found the brands, their order, and the length of the lists all changed from run to run. Fishkin’s conclusion was that “visibility % across dozens to hundreds of prompts run multiple times is a reasonable metric.”
Sample size matters as much as repetition. Otterly’s September 2026 stability study found that with only 10 prompts, nine out of ten of the brand coverage results it measured landed somewhere between 39% and 71%, a spread wide enough to tell almost any story you like. That doesn’t mean everyone needs exactly 100 prompts. It means a small, narrow prompt set gives you an unstable picture, and that repeated runs of one prompt aren’t independent evidence about the whole buyer population.
Step 6: compare like with like
A trend needs the same prompts, competitors, platforms, markets, and counting rules in both periods. If any of those change, write it down and recalculate the history, or you’ll end up celebrating an improvement you created by editing the measurement.
What is a good AI share of voice?
There isn’t a universal good number, and I’d be suspicious of anyone who gives you one. Twenty percent means something very different in a category with two serious competitors than in one with twenty, and it matters whether your share comes from purchase recommendations or from broad informational answers.
Judge it against three things instead: the competitors your buyers actually consider, your own history under the same conditions, and the buying situations where your product has a real advantage. A category benchmark helps only if it uses a compatible method, competitor set, and prompt sample. An “industry average of 30%” with no method attached isn’t a target.
Where the overall number hides the problem
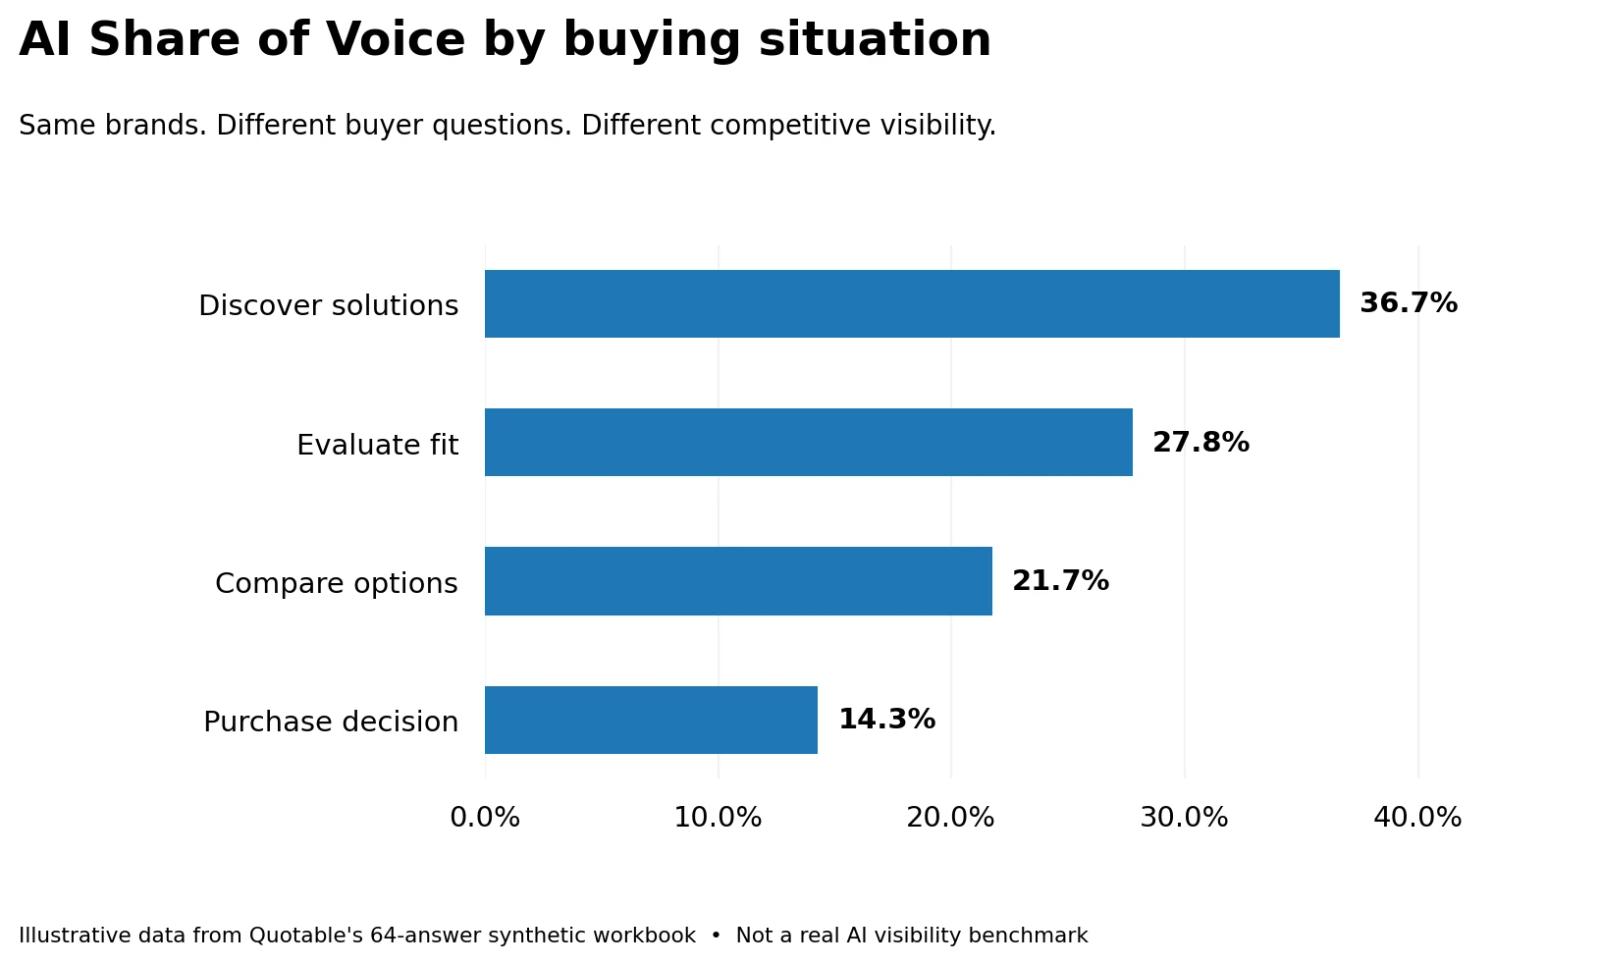
The most useful thing you can do with share of voice is break it down by buying situation. Here are the same 64 made-up answers, split up:
| Buying situation | Your mentions | Total brand mentions | Mention share |
|---|---|---|---|
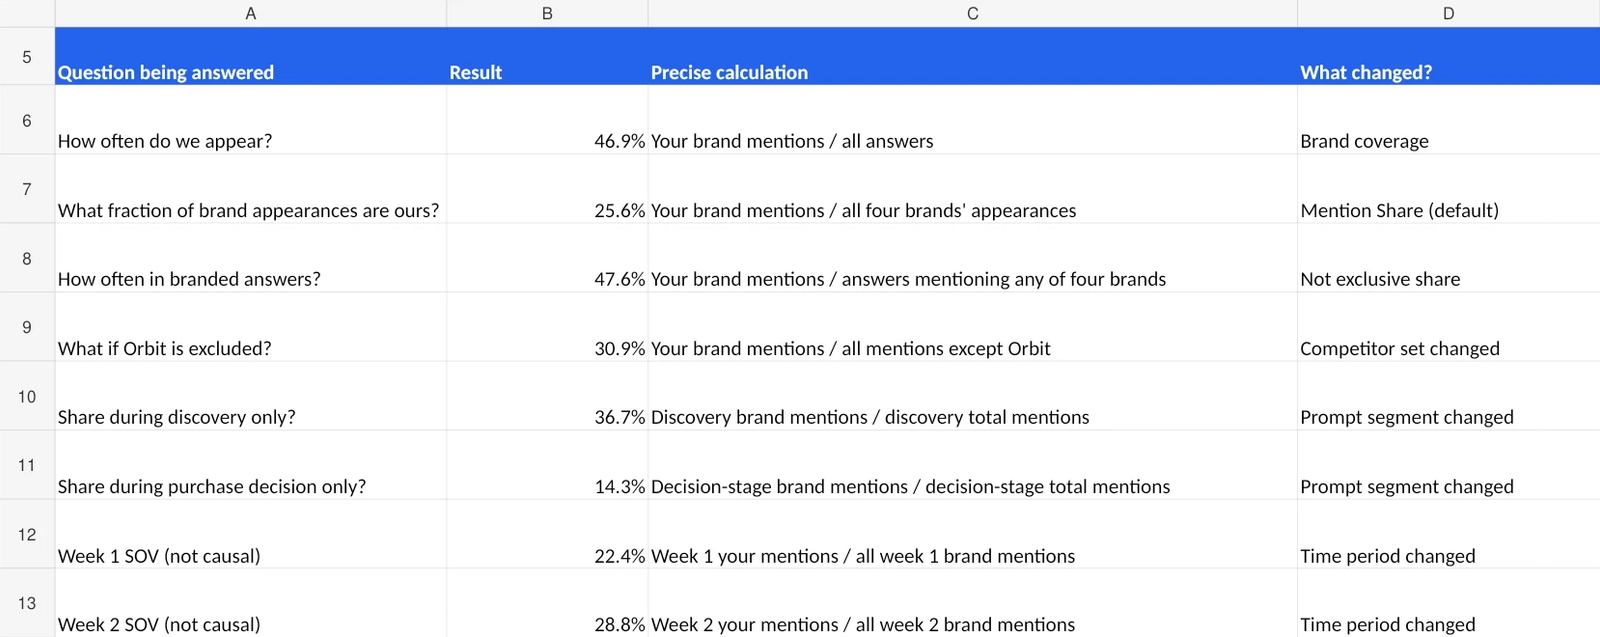
| Discover solutions | 11 | 30 | 36.7% |
| Evaluate fit | 10 | 36 | 27.8% |
| Compare options | 5 | 23 | 21.7% |
| Purchase decision | 4 | 28 | 14.3% |
| Overall | 30 | 117 | 25.6% |
The headline says 25.6%. Underneath it, the brand does fine while buyers are discovering the problem and fades as the questions get closer to a purchase, and in the purchase-decision group, 12 of 16 answers name at least one competitor and leave Your Brand out. That doesn’t explain why. It tells you which answers to read first.
Research points the same way. A September 2026 paper that tested six large language models across five product categories found that once prompts included a buyer’s budget, experience, intended use, and other needs, the brands being recommended changed. One generic category prompt doesn’t represent a market.
Two brands with the same mention share can also be in very different positions. One gets named in every broad list, the other gets recommended whenever a buyer states the requirements it’s built for, and only the second is winning deals. Look at recommendations inside the buying situations that matter, and remember that an answer can name you while recommending someone else.
How to improve AI share of voice
Don’t start with the percentage. Start with the answers where relevant competitors appear and you don’t, and ask why. The answer to that question decides what you change.
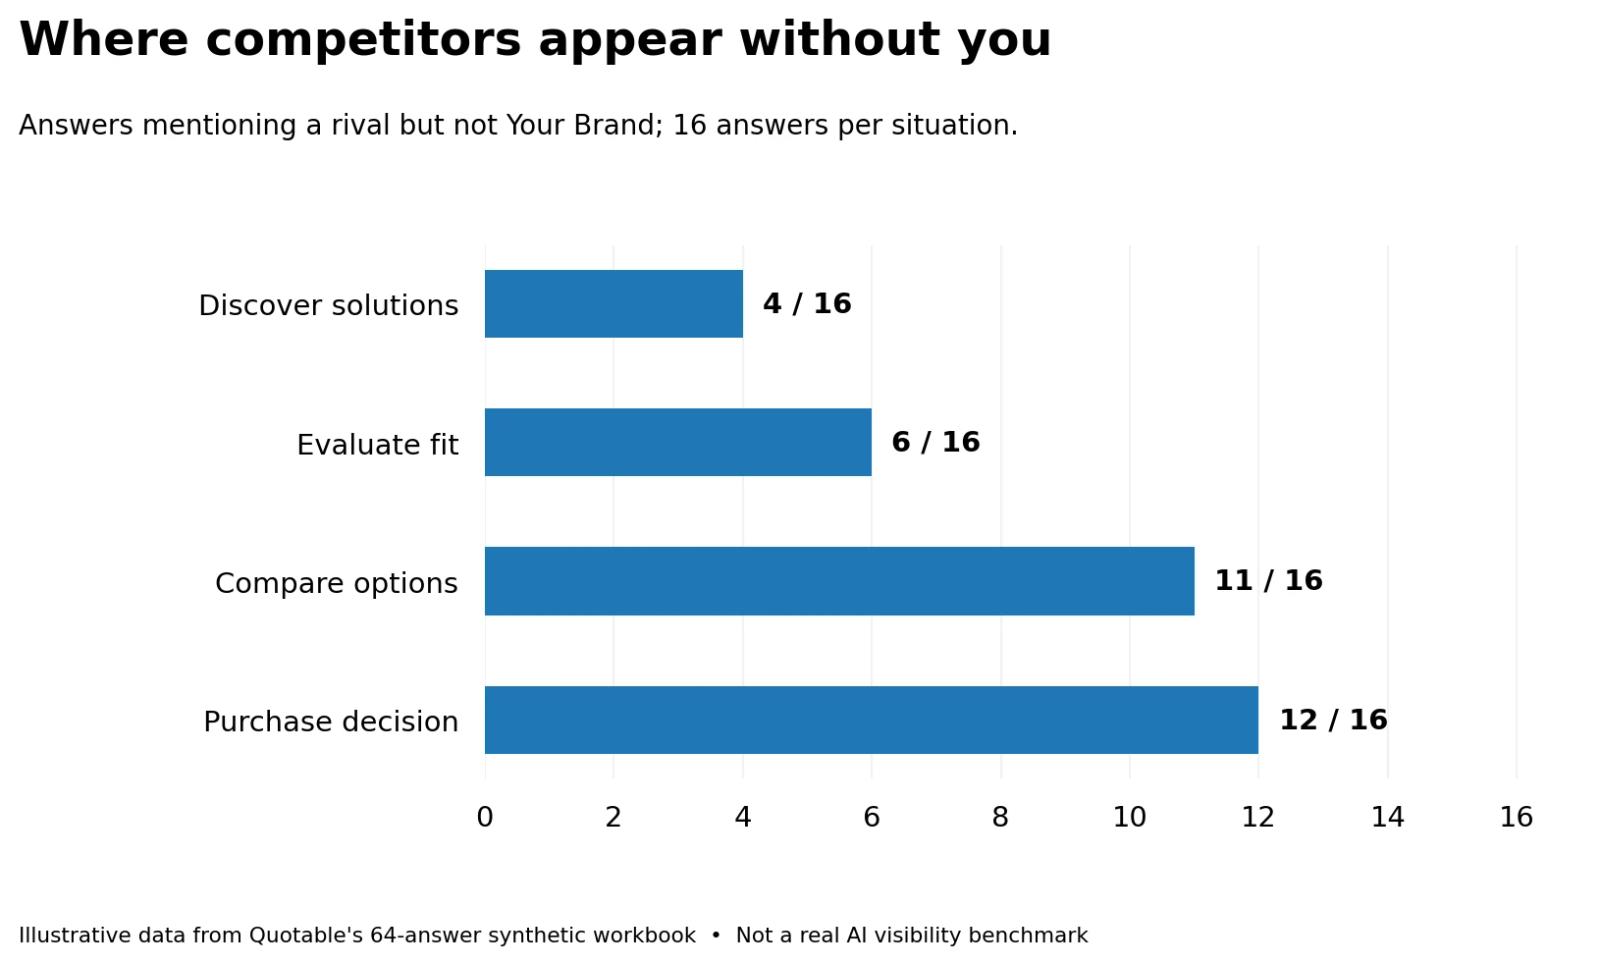
Filter for competitor-only answers on questions from customers you can actually serve; the Opportunity Matrix tab does this by buying situation. Then read them. Is a competitor described as better for enterprise security, easier to implement, a better fit for agencies, cheaper for a specific budget? Check whether the claims are true. You might be missing because you don’t meet the requirement, or because the evidence that you do is unclear, outdated, or hard to find, and those are different jobs:

| What you see | What to look into | What to do |
|---|---|---|
| Competitors appear and you don’t | Which requirements or use cases earn them a place | Strengthen your evidence for the requirements you’re missing |
| You appear but aren’t recommended | The objections or fit judgments in the answer | Clarify positioning, limitations, proof, and fit |
| Strong in discovery, weak at purchase | The deciding requirements you’re absent for | Build content and proof for those situations |
| Your pages get cited but you aren’t picked | Whether the content connects to the product | Make the product’s relevance clearer where it’s real |
| Several brands drop at once across platforms | Whether collection or retrieval changed | Check the measurement and sources first |
| Your score rose after a competitor was removed | Whether the denominator changed | Recalculate before claiming progress |
When the gap is evidence, the usual fixes are accurate product and feature documentation, clear notes on integrations and limitations, real customer examples with outcomes you can verify, comparison content based on actual differences, current pricing and availability, and credible independent reviews and coverage. Where web search is involved, check access too: OpenAI’s crawler documentation separates OAI-SearchBot, which supports ChatGPT search, from GPTBot, which is about model training. Allowing a crawler is a prerequisite, and it guarantees nothing about being retrieved or recommended.
Then measure it like an experiment. Write the observation (“we rarely appear in recommendations for agency project management”), the hypothesis (“answers lack clear evidence connecting us to agency workflows”), the action (“publish an accurate agency use-case resource and fix the related docs”), and the measurement (“rerun the same prompts, competitors, platforms, and conditions”). If mentions and recommendations rise and stay up, that’s encouraging, and it still isn’t proof the page caused it. Compare against relevant prompts you didn’t target before you claim credit.
Why your share of voice moves when you did nothing
Usually it’s one of three things. The answers changed, because models vary between runs and retrieval sources come and go. The market changed, because a competitor launched something, got coverage, or collected new reviews. Or the measurement changed, because someone edited the competitors, prompts, platforms, geography, or scoring rules.
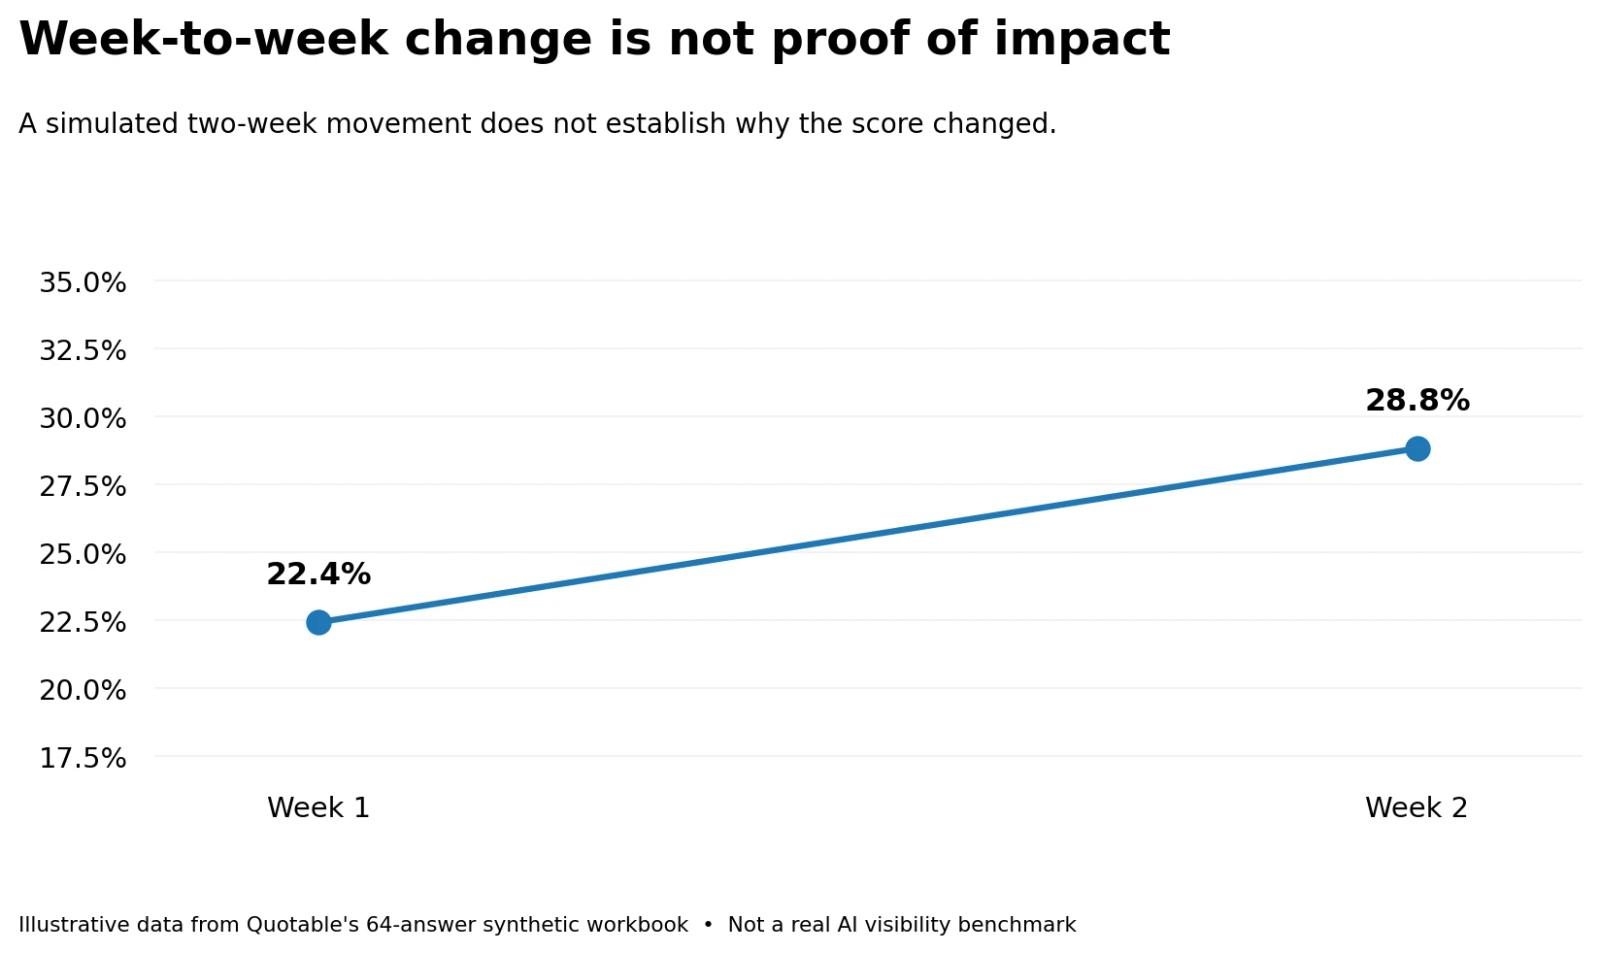
The workbook’s example data shows how tempting this gets. Mention share rises from 22.4% in week one to 28.8% in week two, a 6.4-point jump in made-up data, with no intervention behind it. Check the setup and read the answers before anyone writes “growth” on a slide.
How to track AI share of voice automatically
A spreadsheet is the right place to start, because it forces you to understand exactly what you’re counting. It gets painful fast once you’re running several assistants, dozens of buyer questions, repeated runs, and a competitor set that keeps evolving.
This is the part where I talk about the tool I build, so adjust for the bias. Quotable runs your prompts on a schedule, captures answers client-side from the AI apps rather than the API, and keeps the full answer, the brands in it, and the sources behind it for every run. You group prompts by topic and intent, so share of voice in purchase-stage questions doesn’t get averaged away by awareness questions, and when you find a competitor-only gap, Quotable Agent can dig into the answers and sources with you and draft the page or documentation fix. Plans start at $99 a month, and you can try Quotable on your own prompts.
Whatever tool you look at, ask whether you can open the original answers, whether it separates mentions from citations, whether it compares like-for-like periods, whether it shows which buying situations moved, and whether it explains its method. A better dashboard still can’t rescue a prompt set that doesn’t sound like your buyers.
Does AI share of voice predict sales?
Not on its own. It describes relative exposure inside a sample, and it can’t tell you whether a buyer saw the answer, preferred you, visited your site, or bought anything. A higher score also doesn’t mean the extra appearances happened anywhere commercially useful.
Traffic analytics miss part of the picture from the other side. In a July 2025 study of 900 US adults’ browsing, Pew Research Center found people clicked a traditional Google result on 8% of visits that showed an AI summary, against 15% of visits without one. That’s Google AI Overviews and not ChatGPT, and it isn’t a causal estimate of anything, but it explains why exposure and outcomes need separate reporting. Use share of voice for competitive visibility, and judge business impact with qualified leads, self-reported discovery channels, branded search, referrals, and conversions.
How to report AI share of voice
A good report makes the method clear and the next step obvious. Using the made-up dataset:
| Field | Example |
|---|---|
| Mention share | 25.6% |
| Brand coverage | 46.9% |
| Scope | 16 prompts, 2 AI platforms, 2 periods |
| Observations | 64 example answers |
| Competitor set | Atlas, Nova, Orbit |
| Weakest buying situation | Purchase decision, at 14.3% mention share |
| Main question | Why do competitors appear in decision-stage answers without Your Brand? |
| Next step | Read the 12 competitor-only decision-stage answers |
For a real report, add the collection dates, response count, prompt set, competitor definitions, and any method changes. “Our AI share of voice went up six points” means nothing without them.
Before you put a share of voice number on a slide
A brand can lead on overall share of voice and still be missing from the answers where buyers decide. So before the number goes into a report, check three things: the competitor set hasn’t changed since last time, the prompts sound like your buyers, and you’ve read the purchase-stage answers behind the percentage.
Download the free AI share of voice workbook to build your first baseline, or try Quotable if you’re ready to make it a weekly habit.
A note on the examples: the workbook’s 64 answers and the brands in them are made up to demonstrate the calculations. Study findings are attributed to their original publications.
Frequently asked questions
What’s the formula for AI share of voice?
Your brand’s answer mentions divided by all tracked brands’ answer mentions, times 100. Some tools use answer coverage or weighted exposure instead, so check the numerator, denominator, and competitor set before comparing scores.
Can I calculate it for free?
Yes. Run relevant prompts through AI assistants, record which brands appear, and calculate in a spreadsheet. The free Quotable workbook does the calculations for you.
How many prompts should I track?
There’s no universal minimum. Start with varied buyer questions, repeat runs, and add prompts while the results still swing a lot when you change a few of them. More prompts don’t help if they’re the wrong prompts.
How often should I measure it?
Weekly works for spotting changes and monthly for strategy, and consistency beats frequency either way. Keep prompts, competitors, and conditions comparable between periods.
Is AI share of voice the same as AI citations?
No. A mention is your brand in the answer text, and a citation is a linked source. Your site can be cited without your product being recommended, and your brand can be mentioned with no citation at all.
Why do different tools show different scores?
They use different prompts, markets, platforms, competitor sets, sampling, weighting, or formulas. Two different scores don’t mean one of the tools is wrong.
Can AI share of voice go above 100%?
Mention share can’t, because your appearances are part of the total. Coverage-style metrics can add up to more than 100% across brands, since several brands can appear in the same answer.
What should I fix first if mine is low?
The relevant answers where competitors appear and you don’t. Read the buyer’s requirement, the reasons the answer gives for the competitors, and the sources it used, fix one specific evidence or positioning gap, and measure again on the same prompts.
Written by